Residential Real Estate Market Activity in Noank – Greg Broadbent – Spring 2017
Mary Skinner / May 31, 2016
Residential Real Estate Market Activity in Noank – Greg Broadbent – Spring 2017
Summary
In summarizing real estate market activity for Noank in April, Realtors had 15 homes listed for sale on May 1st. This was one more than the 14 that were actively listed on April 3rd. 12 of those 15 homes were also actively listed a month ago on April 3rd. And 7 of these same listings were active three months ago on February 1st as well. A sales transaction closed for one home in April, and one home was under deposit as of May 1st also. Finally, there were 3 new listings added to the CTMLS in April for Noank.
Active Listings
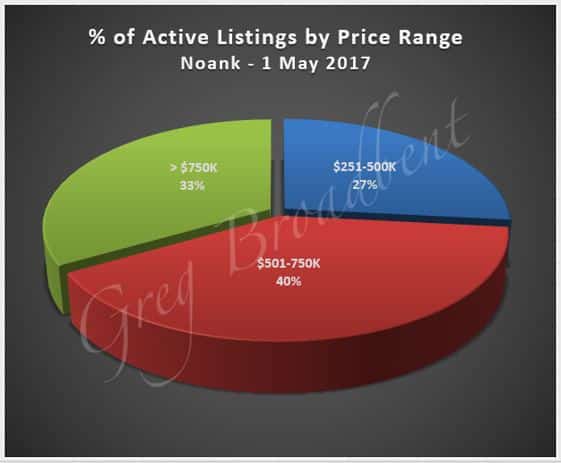
The average listing price for the 15 homes listed on May 1st was a little over $730,000. The median was lower at almost $650,000 with prices in the range from about $275,000 to almost $2M. And the chart below gives a percentage breakdown of homes in different price ranges listed for sale in Noank.
The average size of these homes was a little short of 2800 square feet with a 2166 median value. Living area ranges extended broadly from over 1250 to slightly over 7800 square feet. And, they offered between 2 and 5 bedrooms with 3.4 as the average. In addition, these homes included from 1 to 5 full bathrooms with an average of 2.1 full bathrooms. Also, 10 of these 15 homes (~67{1e8c2123a5fc2e74f65ee6569c74c8e387a770e50f804d21156cb7816b634b77}) included from 1 to 3 half-bathrooms as well. The following charts give some additional perspective on the attributes of the homes actively listed on May 1st.
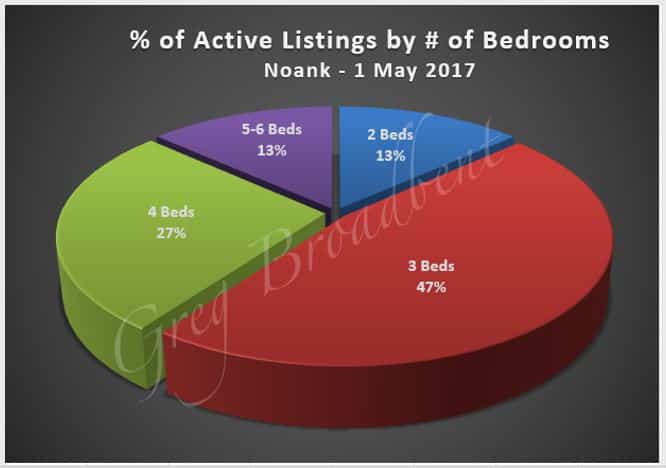 |
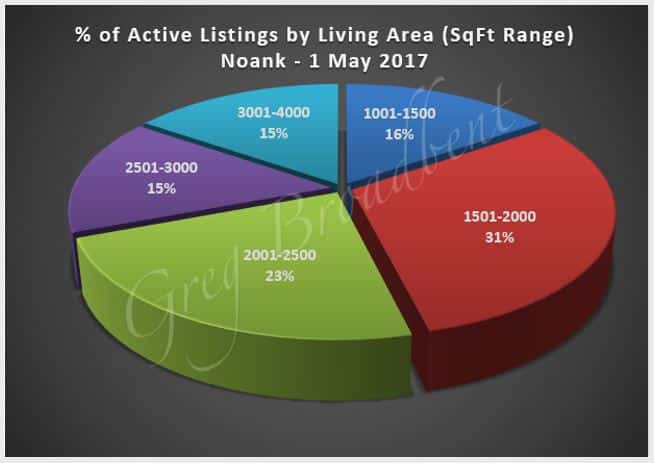 |
And then the chart below provides some additional detail showing how the # of bedrooms and range of living area sizes varied with the list price.
Recent Activity
Sales have closed on 3 homes for the first four months of 2017 in Noank. 2 of these were in the first quarter and one last month in April. These 3 homes ranged in price from just over $200,000 to $460,000. The average price was $336,000. These homes all offered either 3 or 4 bedrooms, and either 1 or two full bathrooms. And 2 of the 3 included an additional half-bathroom. Finally, their corresponding listings were active for an average of 297 days. The median value for this metric was 220 days.
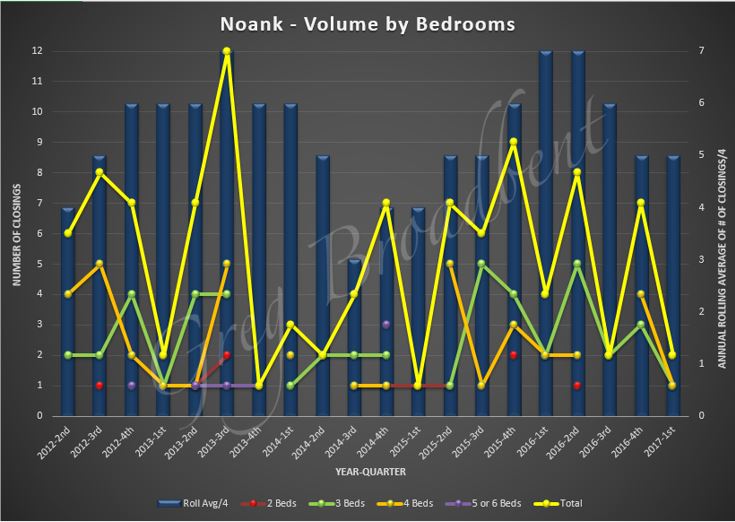
For some perspective about the volume of sales, the chart below shows the number of closed sales by # of bedrooms for the 20 quarters between 2Q2012 and 1Q2017. It shows that the first quarter can be slow. 4 homes closed in 1Q2016, and there was only a single closing in 1Q2015 – however, activity typically picks up as the year progresses.
Past Closings
For comparison with the closing details for 2017 to date, the average living area for the 4 homes which closed in 1Q2016 was just over 2700 square feet. These homes also offered either 3 or 4 bedrooms. However, they also included either 2 or 3 full bathrooms. And 2 of the 4 had an additional half-bathroom as well. The average closing price was almost $630,000 and the median was almost $475,000. And, the listings for these homes were active for an average of 129 days with a more or less equal median of 127 days.
Longer-Term Retrospective
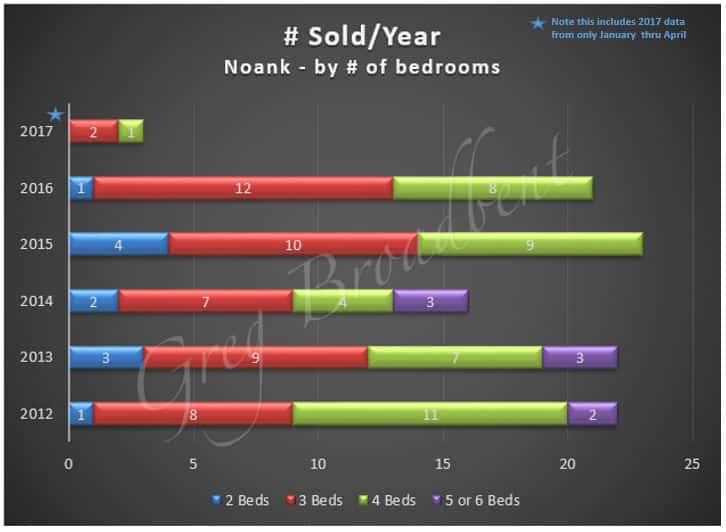
For some additional perspective, the chart below shows the number of homes sold each year in Noank broken out by number of bedrooms. Note that the 2017 activity includes data only from January through April.
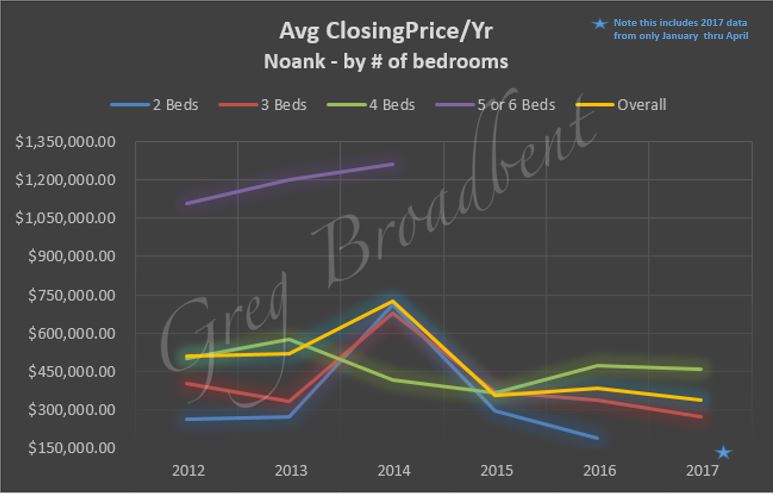
Finally, the chart below provides some information on the past averages of closing prices. Again the averages are broken out by # of bedrooms, but an overall average is included as well. Note that the 2017 data come only from January through April.
Conclusion
We’ll continue to watch market activity in Southeastern Connecticut over the coming months and share trends or other data of interest with you in future blogs.
These residential property data were taken from the CTMLS as of May 1st 2017. Updated information will be posted on our Noank CT Real Estate Page.
If you are looking to buy or sell a home in Noank or to work with a local CT Realtor, please feel free to call us. We look forward to helping you find just the right home for you.
